

36 Key Coaching Statistics For 2026
Last updated: March 2026
36 Key Executive Coaching Statistics
This is a complete, recent, and accurate list of the most important statistics related to executive coaching for 2021. All the stats are curated by going through more than 95+ sources.
The stats go on for a modification every six months, where outdated data is renewed by the current ones.
On this page you’ll find hand-picked stats about:
- Industry Trends
- Demographics
- Opportunities
- Income
- Job retention and turnover
- Challenges
And a whole lot more.

If you're looking to climb professionally, it pays to have as much data on your side as possible - so let's dig in!
Contents
Incomechapter 1:
Market, Growth, and Opportunities
Let’s begin with the most significant statistics about the executive coaching market, its volume and market value, its development, and the opportunities in this sector. I got these stats covered from studies, surveys, reports, and articles. Read on!

- A Fortune 500 company wanted to study the ROI of Executive Coaching. They found that 77% of respondents indicated that coaching had a significant impact on at least one of nine business measures. (source)
- Executive Coaching produced a 788% ROI. The study noted that excluding the benefits from employee retention, a 529% ROI was produced. (Executive Briefing: Case Study on the ROI of Executive Coaching, Merrill C. Anderson, Ph.D., MetrixGlobal, LLC)(source)
- Manchester, Inc. surveyed 100 executives, most of which were from Fortune 1000 companies. Their research showed that a company’s investment in Executive Coaching realized an average ROI of almost six times the cost of the coaching. (Maximizing the Impact of Executive Coaching, The Manchester Review, 2001, Volume 6, Number 1, Joy McGovern, et.al.)(source)
- According to the International Coaching Federation (ICF), 86% of organizations saw an ROI on their Coaching engagements, and 96% of those who had an Executive Coach said they would repeat the process again. (source)
- Laurie Bassi and Daniel McMurrer note that three stock portfolios comprised only of companies that "spend aggressively on employee development" each outperformed the S&P 500 by 17 - 35% during 2003. (source)
- In one study, executive coaching had a 788% ROI thanks to increases in areas like productivity and employee satisfaction. 77% of respondents said that coaching had a significant impact on at least one of nine business measurements. (source)
- A study by McGovern (2001) on the impact of executive coaching shows both the intangible and tangible results of coaching. The researchers studied 100 executives from 56 organizations of various sizes. The results showed that 43% of the companies were able to identify the return on investment of coaching. “The majority of the 43 participants . . . reported between $100,000 and $1 million as the return on investment in executive coaching,” state McGovern (p. 7). (source)
- Cambria Consulting began an ongoing study of the effects of executive coaching in large organizations from the perspective of multiple stakeholders (coach, coachee, managers-sponsors, and others). The results indicate that coaches and coaches perceived the coaching engagement to have higher value estimations than did the managers. In fact, over 85% of the 56 responding coaches and 91% of the 51 responding coaches estimated an overall value of $50,000 during the 18-month coaching process. (source)
- This statistic depicts the expectations in the demand for executive coaching from 2011 to 2019, as reported by professional executive coaches. In the 2019 survey, 23 percent of respondents expected that demand for executive coaching would increase substantially in 2019, compared to 45 percent of respondents who thought demand would increase slightly. (source)
- This statistic depicts the methods used for the delivery of executive coaching from 2012 to 2020 as reported by professional executive coaches. In the 2020 survey, the top service delivery method was in-person, with 33 percent of respondents stating they provided executive coaching in person. (source)
- In the 2019 survey, 23 percent of respondents expected that demand for executive coaching would increase substantially in 2019, compared to 45 percent of respondents who thought demand would increase slightly. (source)
- Research study of Fortune 1000 companies, who had engaged in coaching for performance, skills or change • Most respondents were executives at the VP level or higher • 60% aged between 40-49 • 1/3 earned $200,000 or more per year • Coaching lasted between 6 months and one year •(source)
- Executives stated coaching benefits: • 77% Improved working relationships with direct reports • 71% Improved working relationships with immediate supervisors • 67% Improved teamwork • 63% Improved relationships with peers • 61% Improved job satisfaction • 52% Conflict reduction • 44% Improved organizational commitment • 37% Improved relationships with clients(source)
- A study on executive coaching’s effect revealed an average ROI of 5.7 times the initial investment or a return of over $100,000. (Manchester Inc. study). (source)
- According to surveys by Psychology Today, in order to facilitate the same, executive coaches are being hired by organizations to empower leaders at the top. 48% of all executive coaches are being hired to coach on transitional and situational leadership. Leading change in a way that is the need of the hour and would not only be accepted by all but also be participated by all is what organizations are looking forward to. (source)
- Surveys say that 12% of all executive coaches have taken up the roles of checking up on behavioral aspects and discipline factors in their coachee's professional circles. (source)
chapter 2:
Demographics
This comprehensive list provides exhaustive details of the executive coaching sector. The details are categorized into three categories – the age or generation of the coach practitioners, gender-related stats about executive coaches, and types of clients that are served by the coaches.

Executive Coach Statistics By Gender
- Among Executive Coaches, 47.1% of them are women compared to 46.1% which are men. (source)
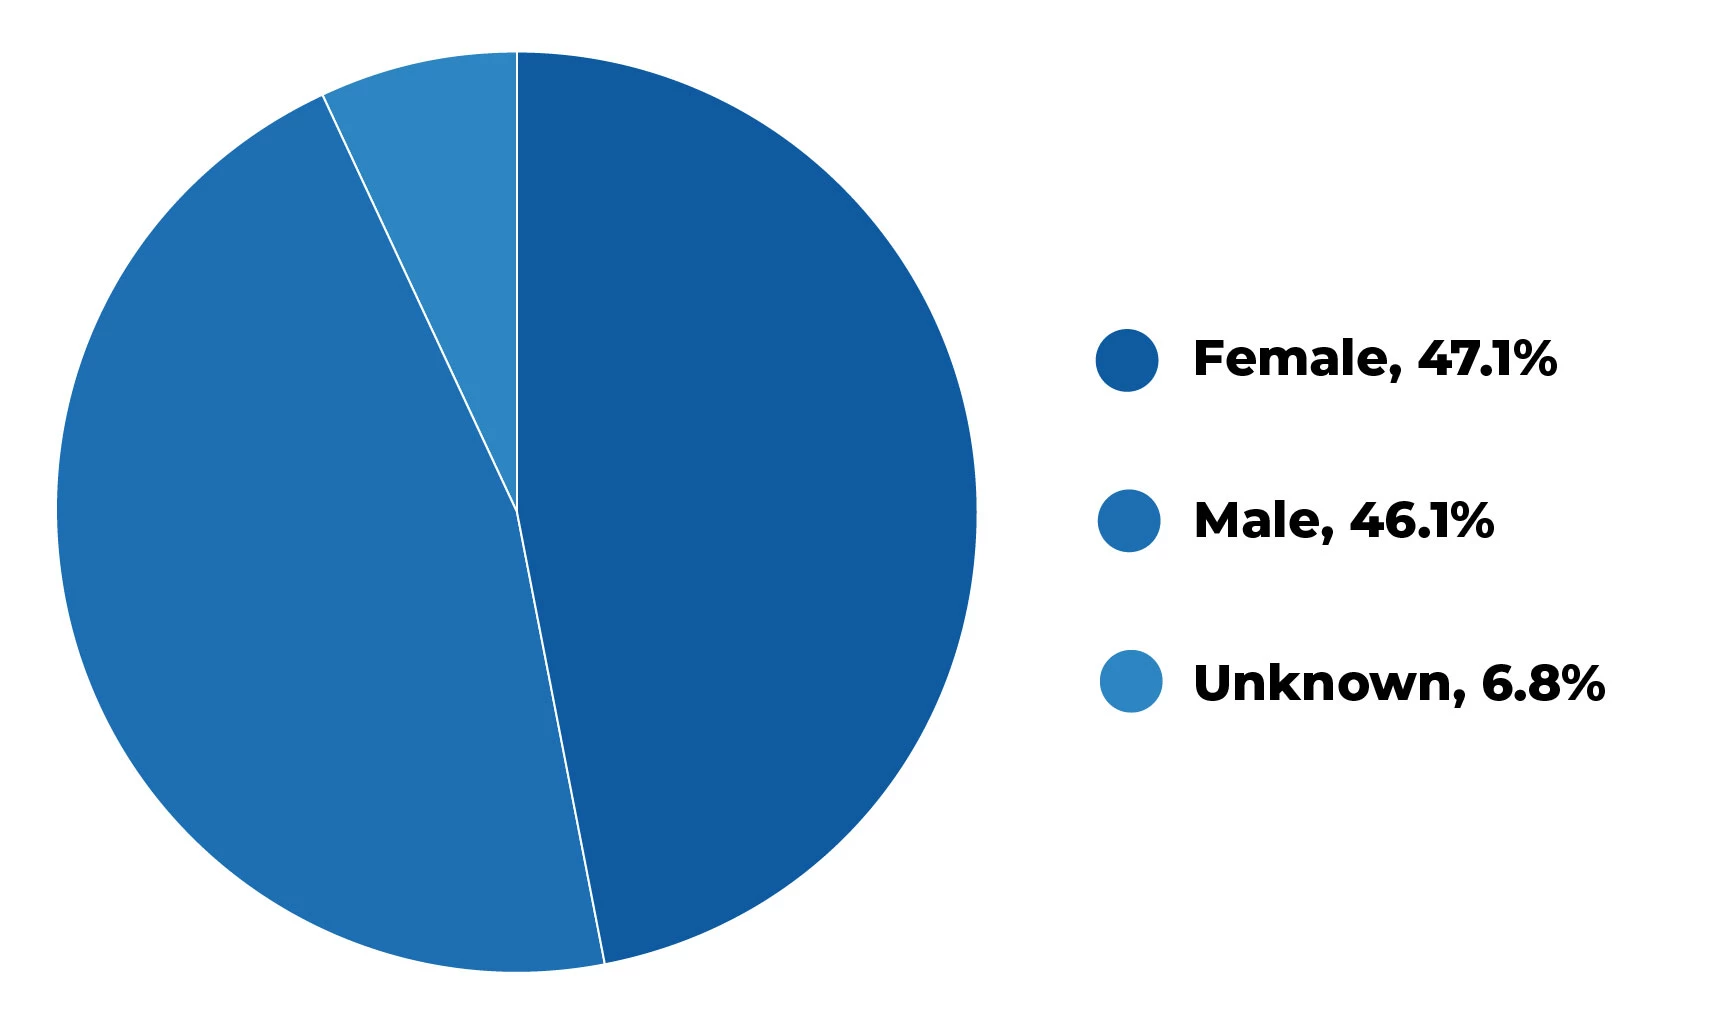
| Gender | Percentages |
|---|---|
| Female | 47.1% |
| Male | 46.1% |
| Unknown | 6.8% |
Executive Coach Gender Over Time
- This data shows how men and women predominate in the Executive Coach position over time.
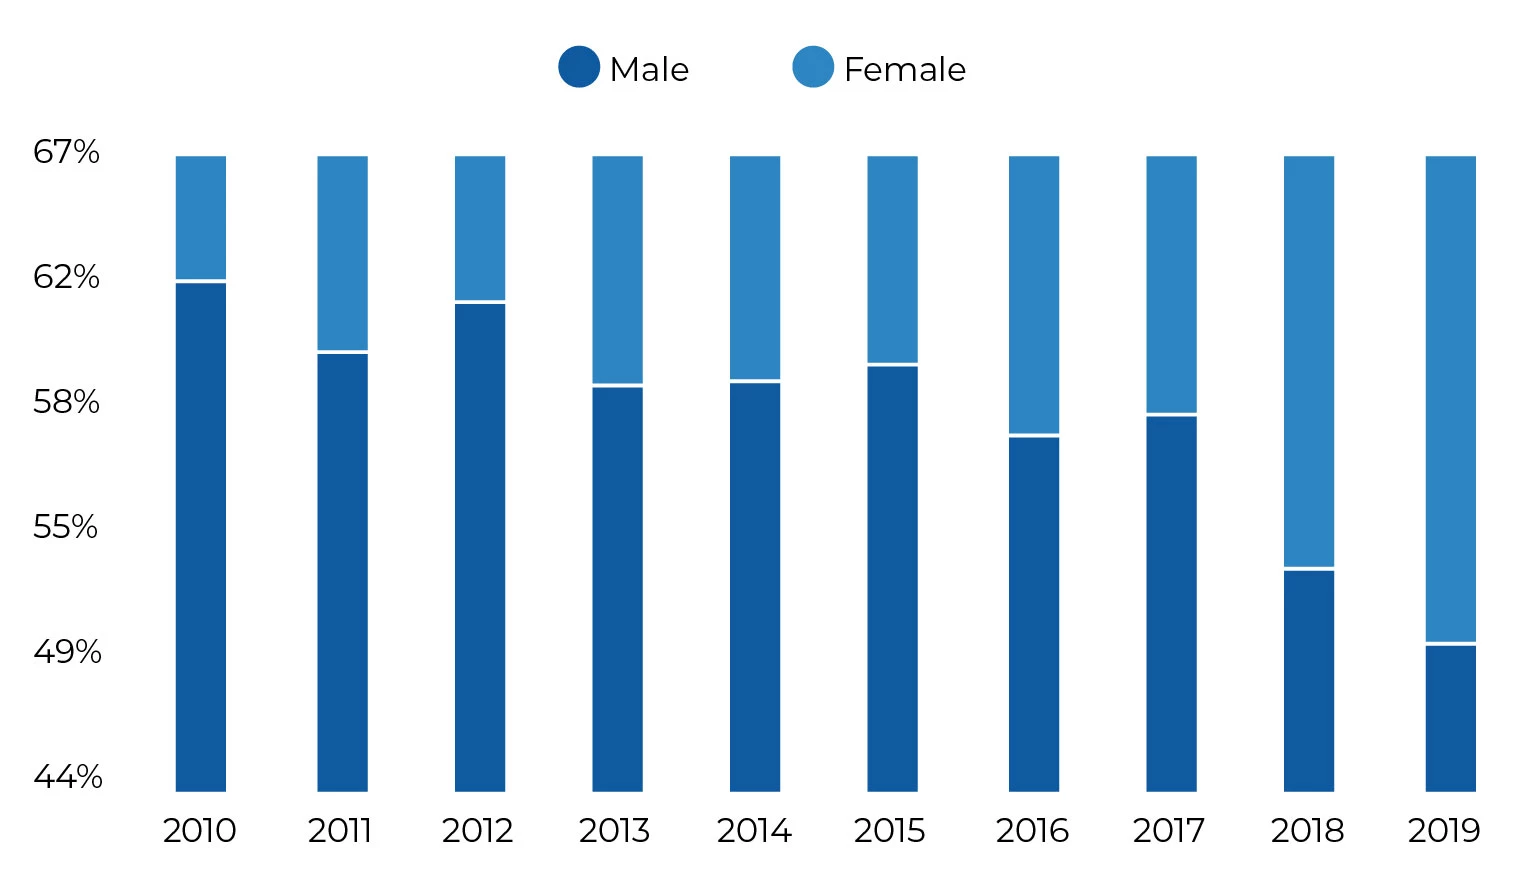
| Year | Male | Female |
|---|---|---|
| 2010 | 62.45% | 37.55% |
| 2011 | 59.91% | 40.09% |
| 2012 | 61.73% | 38.27% |
| 2013 | 58.67% | 41.33% |
| 2014 | 58.84% | 41.16% |
| 2015 | 59.41% | 40.59% |
| 2016 | 56.84% | 43.16% |
| 2017 | 57.57% | 42.43% |
| 2018 | 52.10% | 47.90% |
| 2019 | 49.51% | 50.49% |
Executive Coach Statistics By Race
- The most common ethnicity among Executive Coaches is White, which makes up 66.8% of all Executive Coaches. Comparatively, there are 13.9% of the Hispanic or Latino ethnicity and 9.5% of the Black or African American ethnicity.
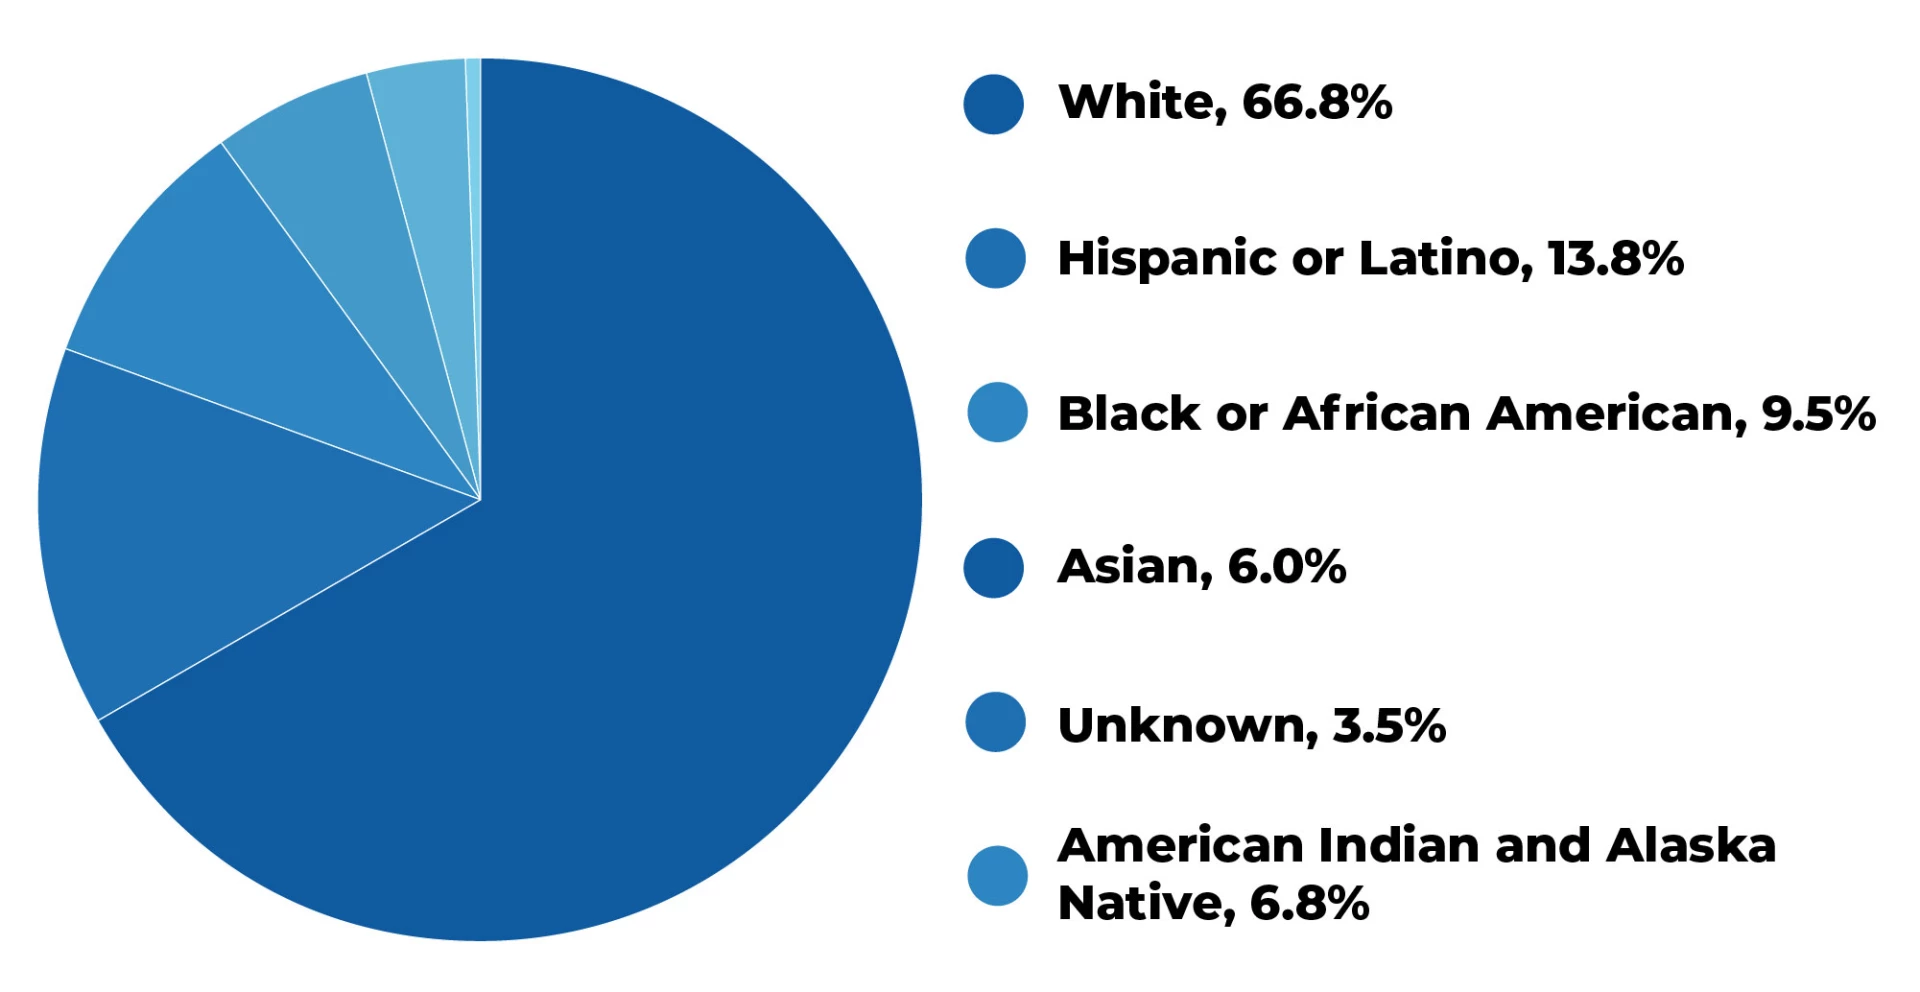
| Executive Coach Race | Percentages |
|---|---|
| White | 66.8% |
| Hispanic or Latino | 13.8% |
| Black or African American | 9.5% |
| Asian | 6.0% |
| Unknown | 3.5% |
| American Indian and Alaska Native | 0.4% |
Executive Coach Race And Ethnicity Over Time
- Using the Census Bureau data, we found out how the percentage of each ethnic category trended between 2010-2019 among Executive Coaches. (source)
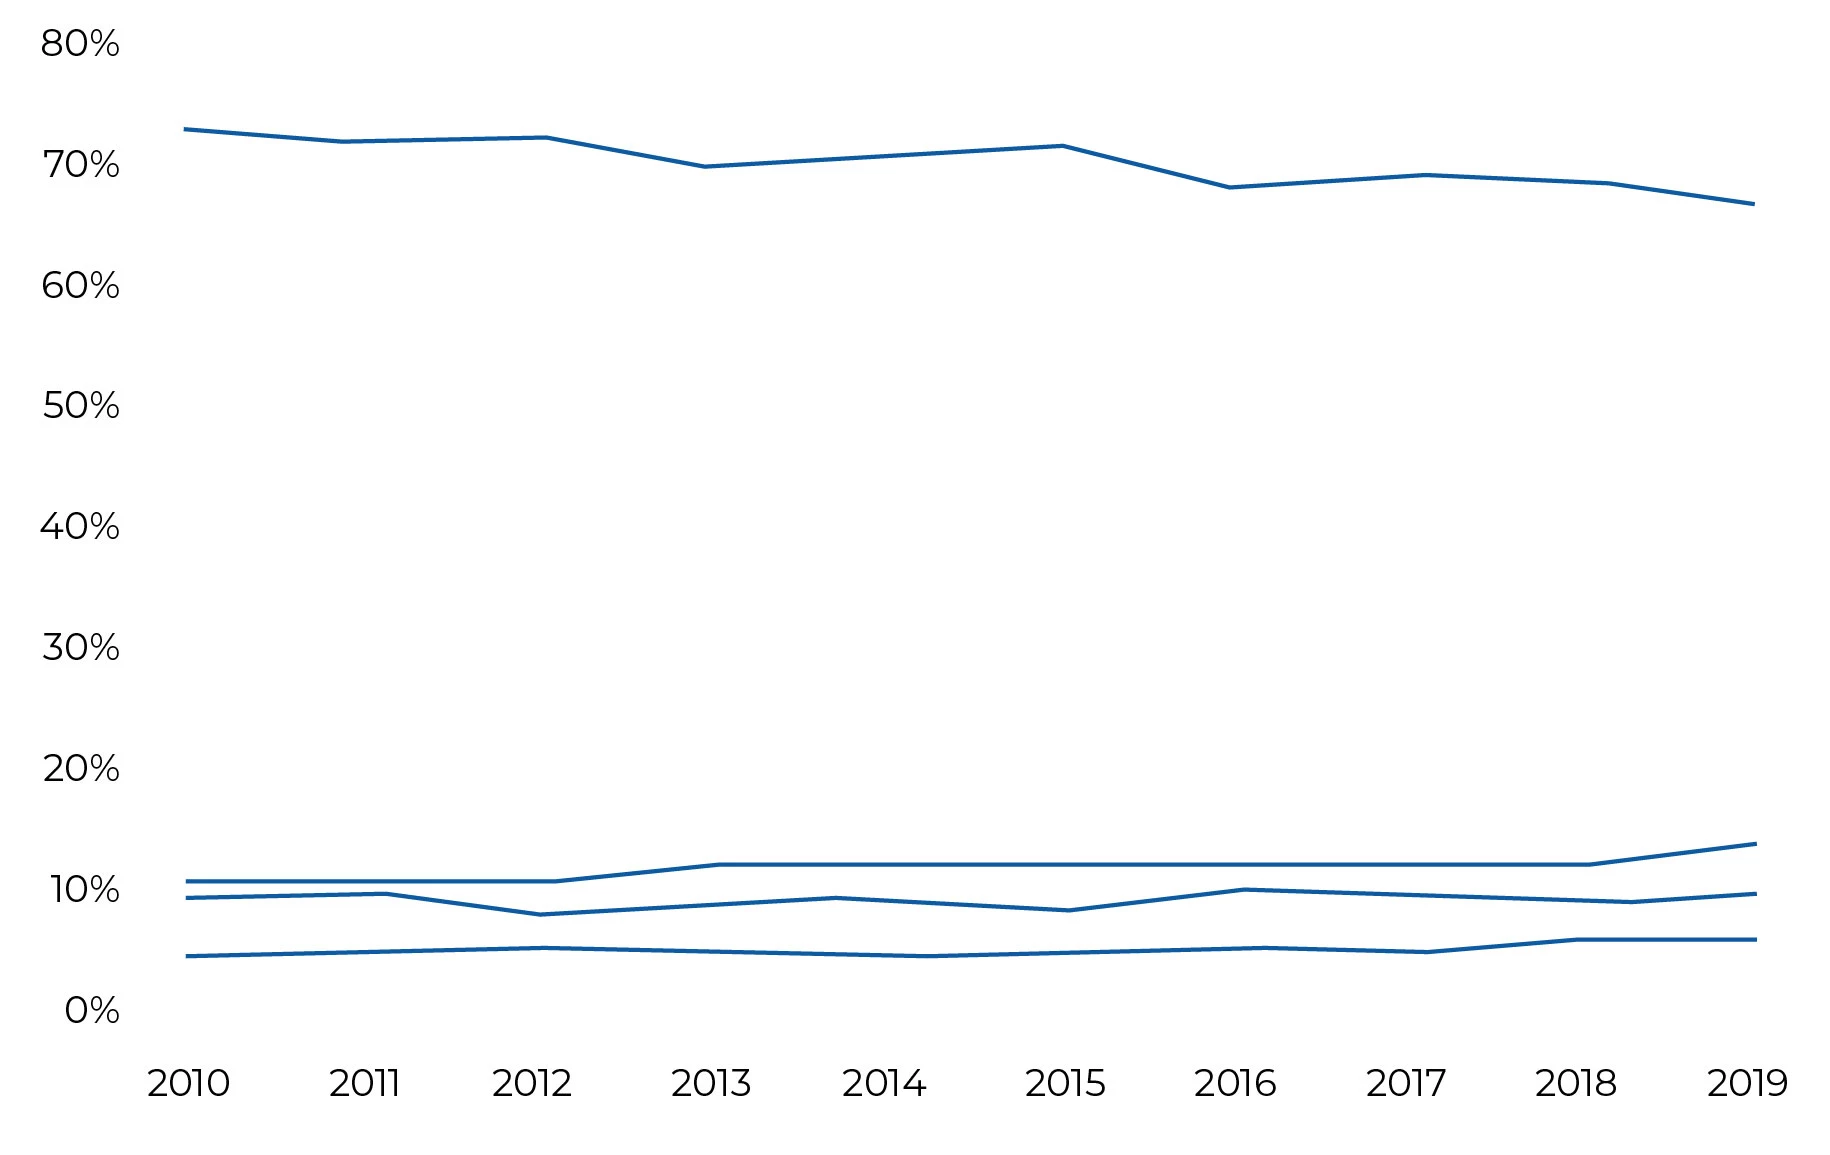
| Year | White | Black or African American | Asian | Hispanic or Latino |
|---|---|---|---|---|
| 2010 | 73.18% | 9.06% | 4.45% | 10.32% |
| 2011 | 72.15% | 9.58% | 4.57% | 10.26% |
| 2012 | 72.58% | 7.99% | 5.18% | 10.45% |
| 2013 | 69.94% | 8.93% | 4.62% | 12.07% |
| 2014 | 70.93% | 9.33% | 4.37% | 11.64% |
| 2015 | 71.80% | 8.22% | 4.74% | 12.06% |
| 2016 | 68.41% | 10.01% | 5.25% | 12.25% |
| 2017 | 69.54% | 9.26% | 4.62% | 12.03% |
| 2018 | 68.75% | 8.81% | 5.78% | 12.27% |
| 2019 | 66.81% | 9.45% | 6.00% | 13.86% |
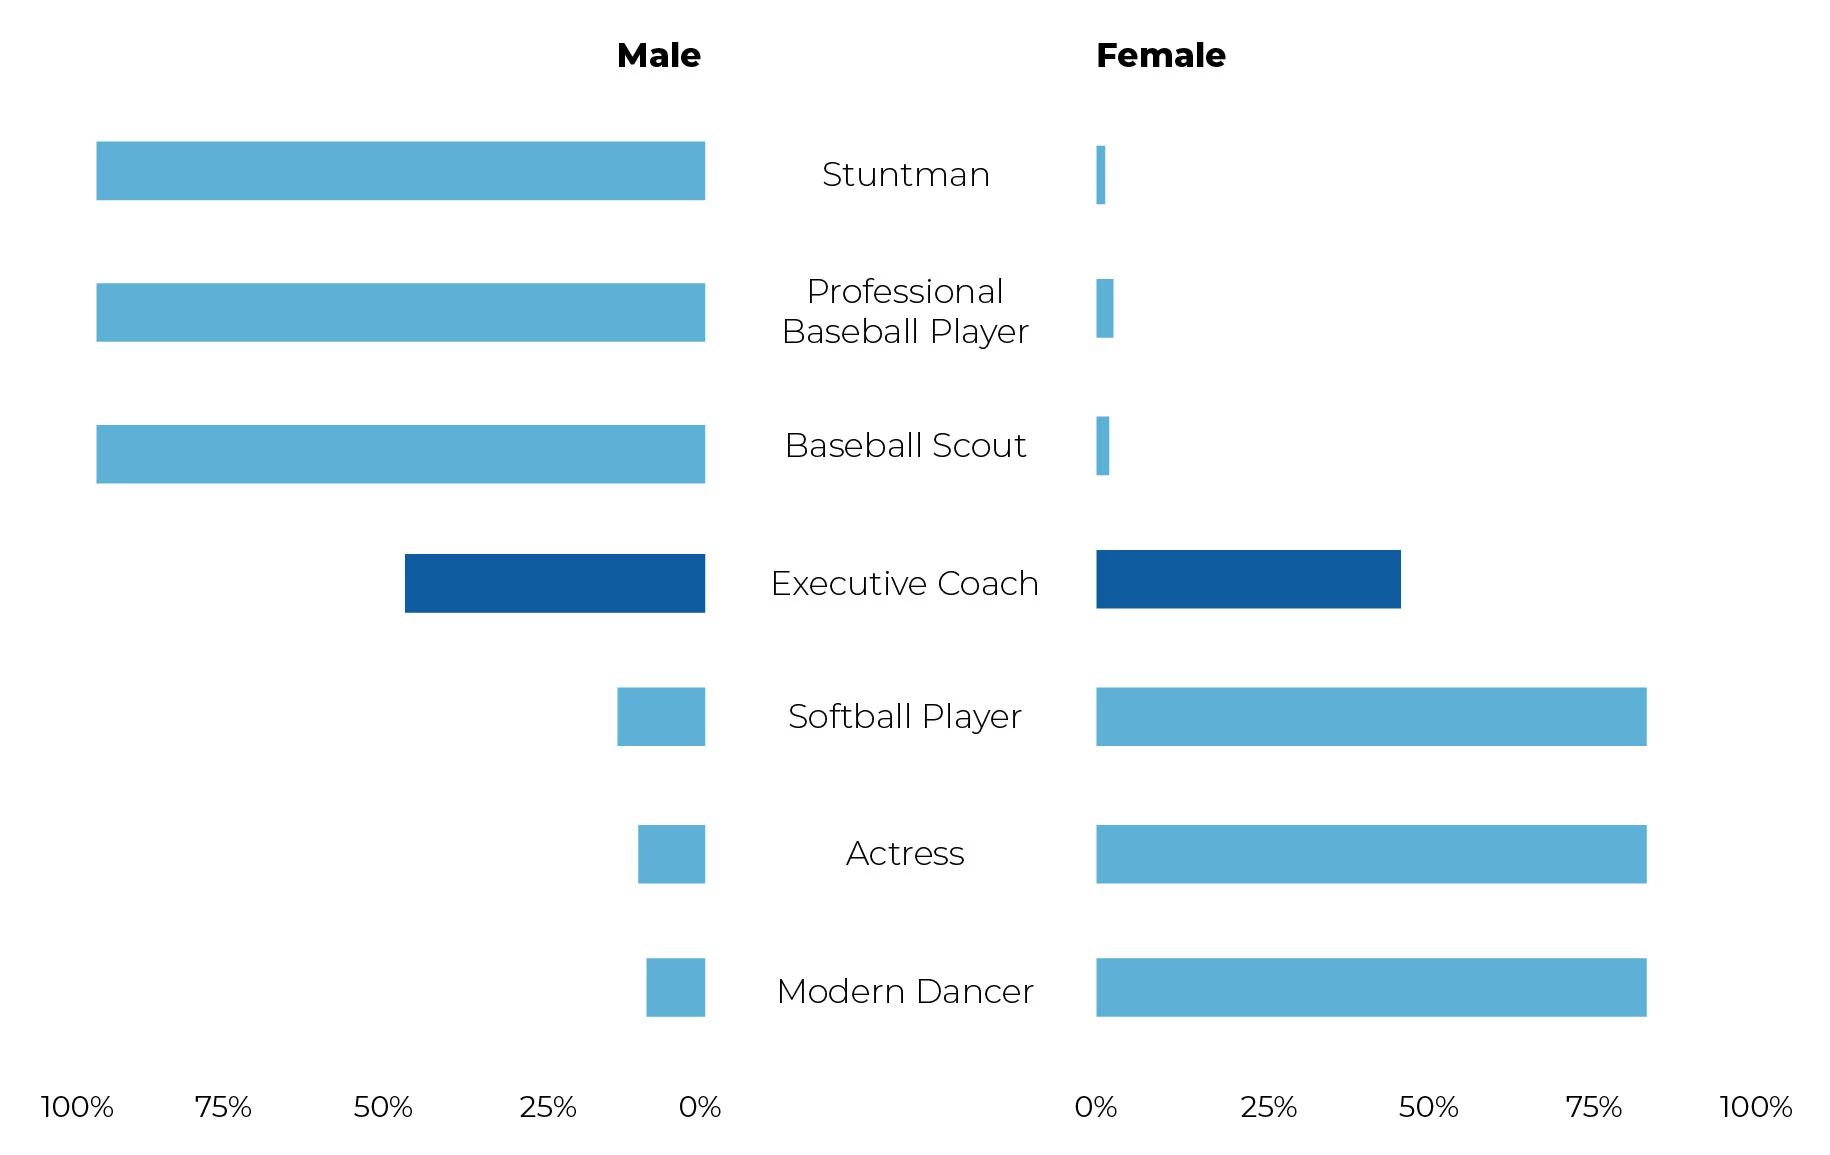
Executive Coach Male to Female Ratio
- We compared this job title with other job titles to see how gender percentages varied. As you can see, Stuntman and Professional Baseball Player have the biggest difference in gender. (source)
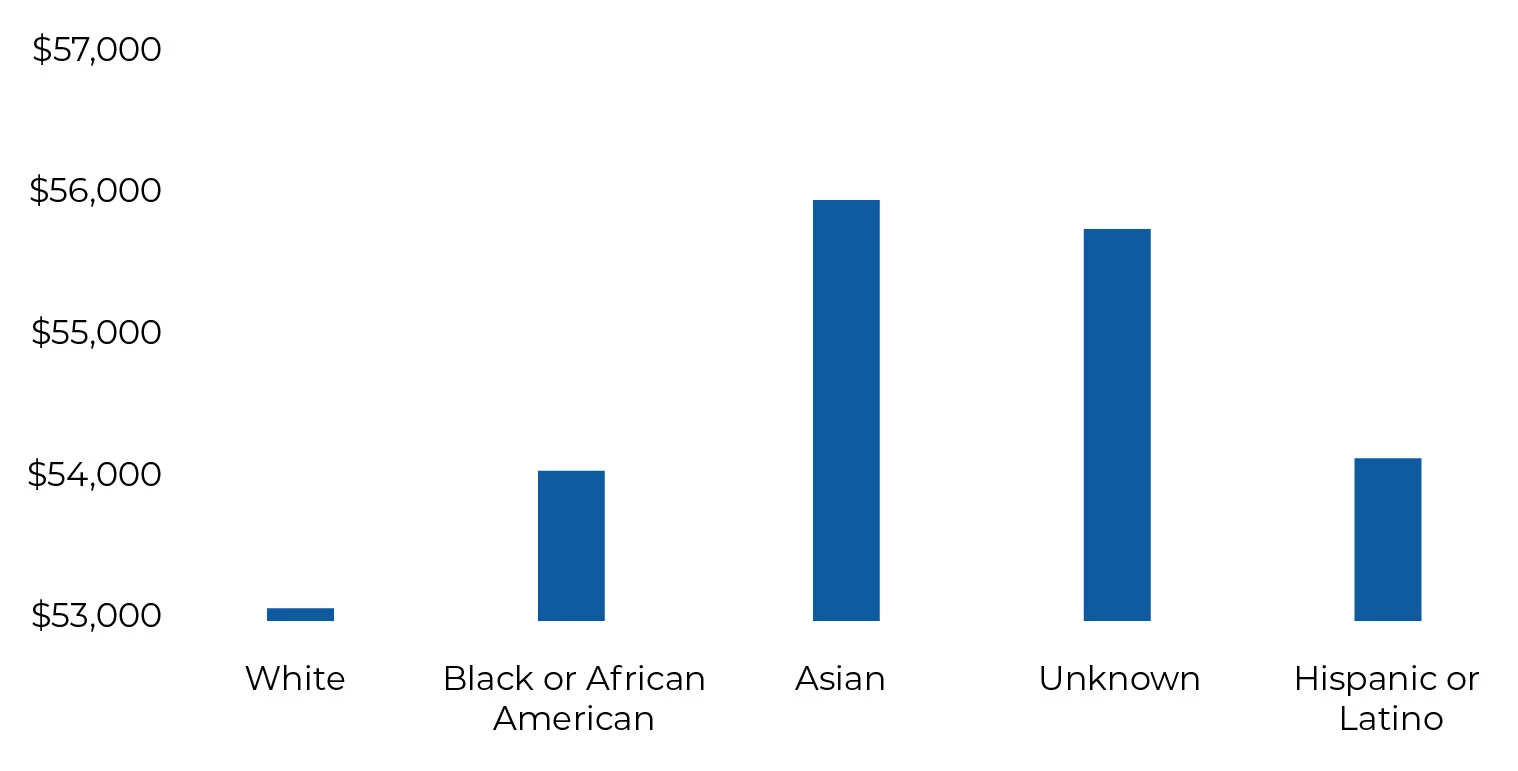
Executive Coach Wage Gap By Race
Average Age Of An Executive Coach
- We determined the average age of Executive Coaches based on ethnicity and gender. (source)
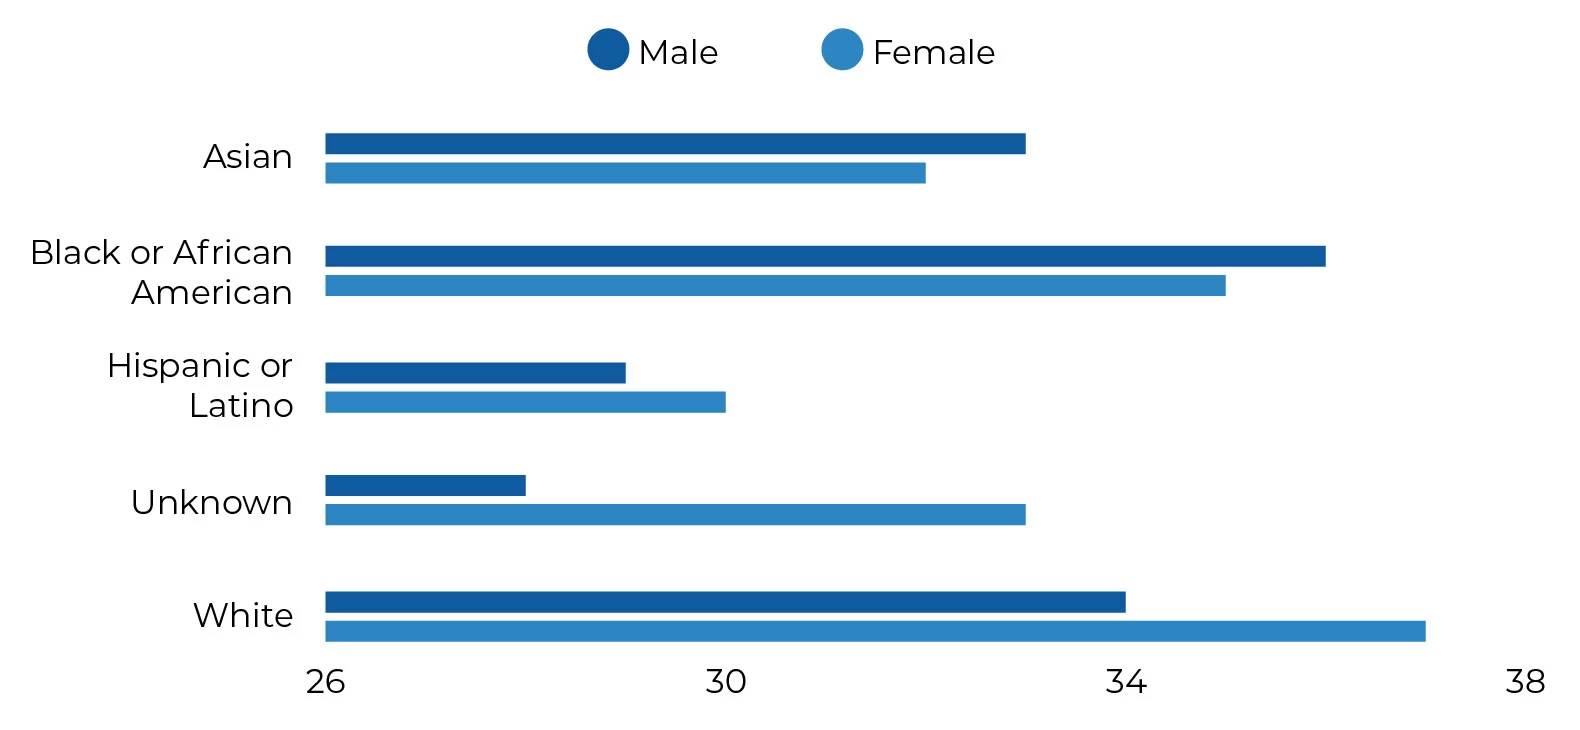
| Race | Male Age | Female Age |
|---|---|---|
| Asian | 31.5 | 31 |
| Black or African American | 33 | 34.5 |
| Hispanic or Latino | 28 | 26 |
| Unknown | 35 | 28.5 |
| White | 35 | 31 |
Executive Coach Age Breakdown
- This chart breaks down the ages of Executive Coach employees. Interestingly enough, the average age of Executive Coaches is 20-30 years old, which represents 32% of the population. (source)
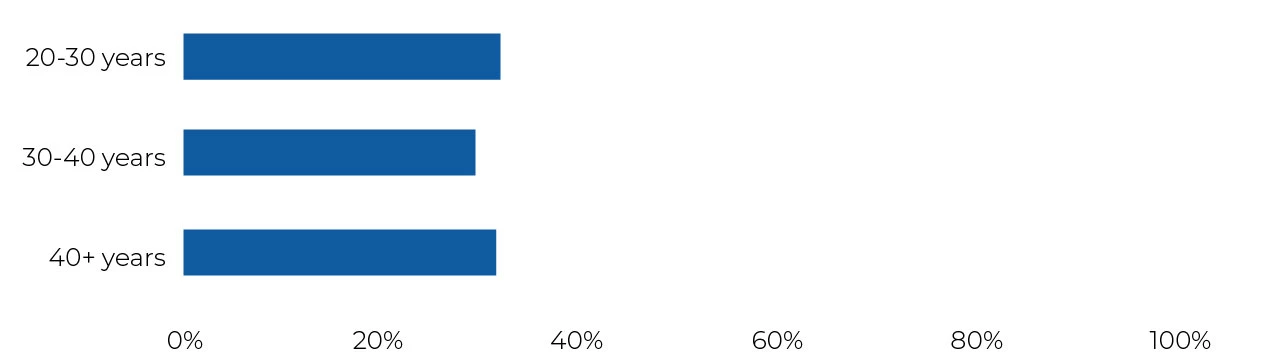
| Executive Coach Years | Percentages |
|---|---|
| 20-30 years | 32% |
| 30-40 years | 29% |
| 40+ years | 31% |
Executive Coach Wage Gap By Education
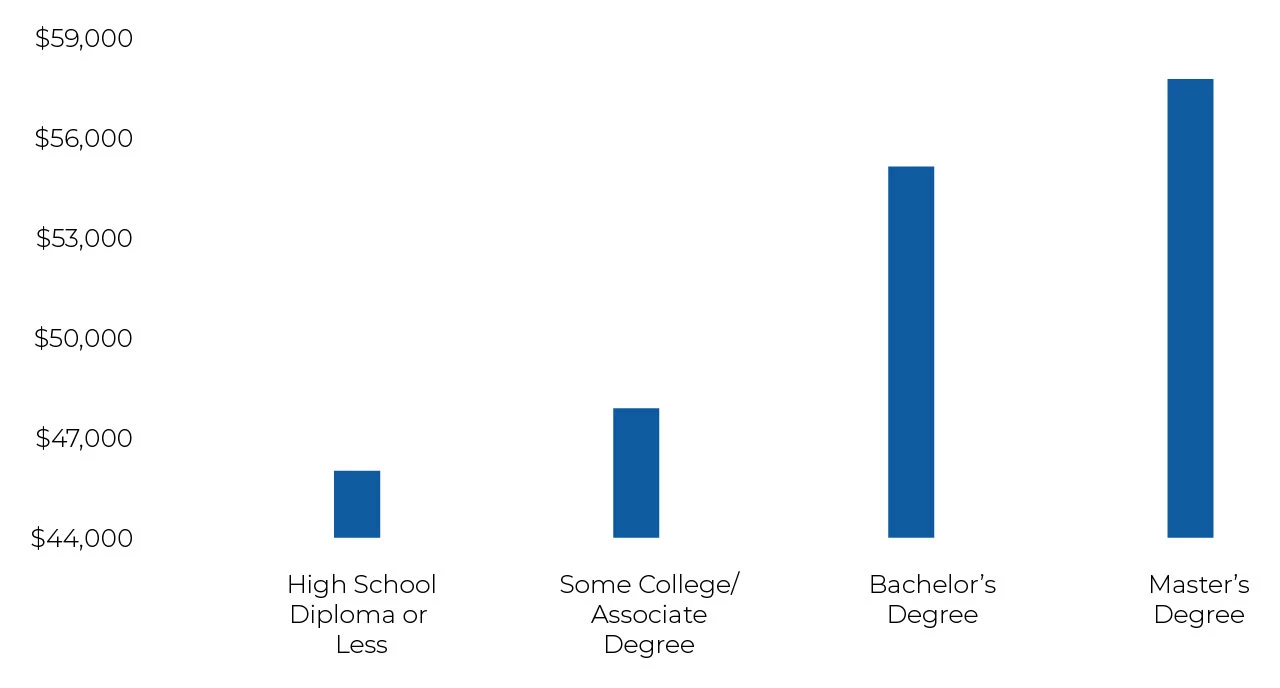
chapter 3:
Types Of Executive Coach Degree Levels
Let's dive into the types of executive coach degree levels taken by executive coaches to know the popular degree level.

- The most common degree for Executive Coaches is Bachelor's Degree 62% of Executive Coaches earn that degree. A close second is Master's Degree with 24% and rounding it off is Doctoral Degree with 6%(source)
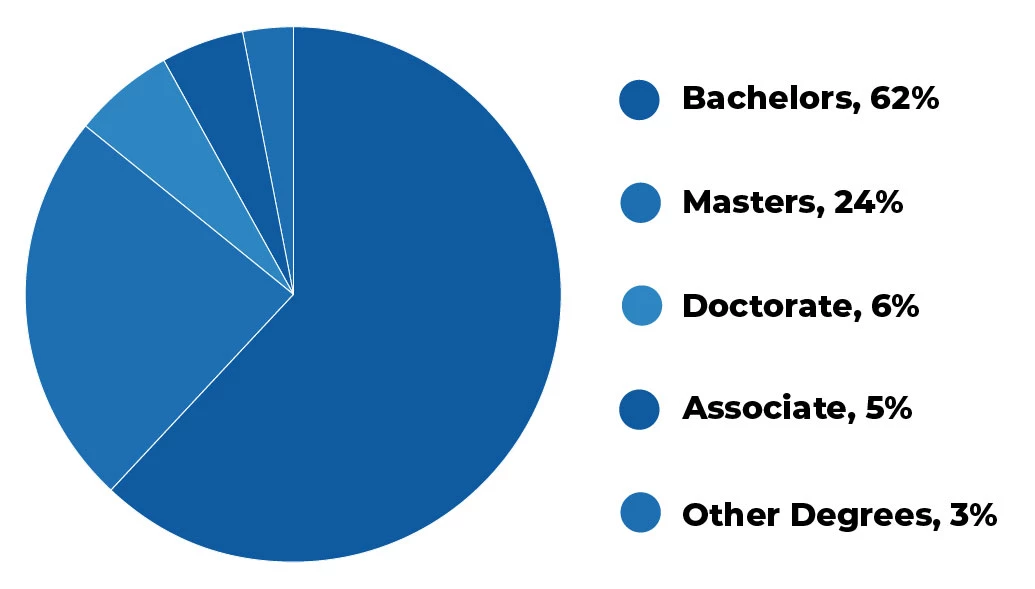
| Executive Coach Degree | Percentages |
|---|---|
| Bachelors | 62% |
| Masters | 24% |
| Doctorate | 6% |
| Associate | 5% |
| Other Degrees | 3% |
chapter 4:
Executive Coach Turnover And Employment Statistics
Moving on to the trends and latest statistics giving hints to clear executive coach turnover and employment statistics.

Executive Coach Unemployment Rate Over Time
- The Bureau of Labor Statistics came in clutch when it came down to figuring out how the unemployment rate has changed over time. Between 2008 and 2018, this is how the number of Executive Coaches changed.
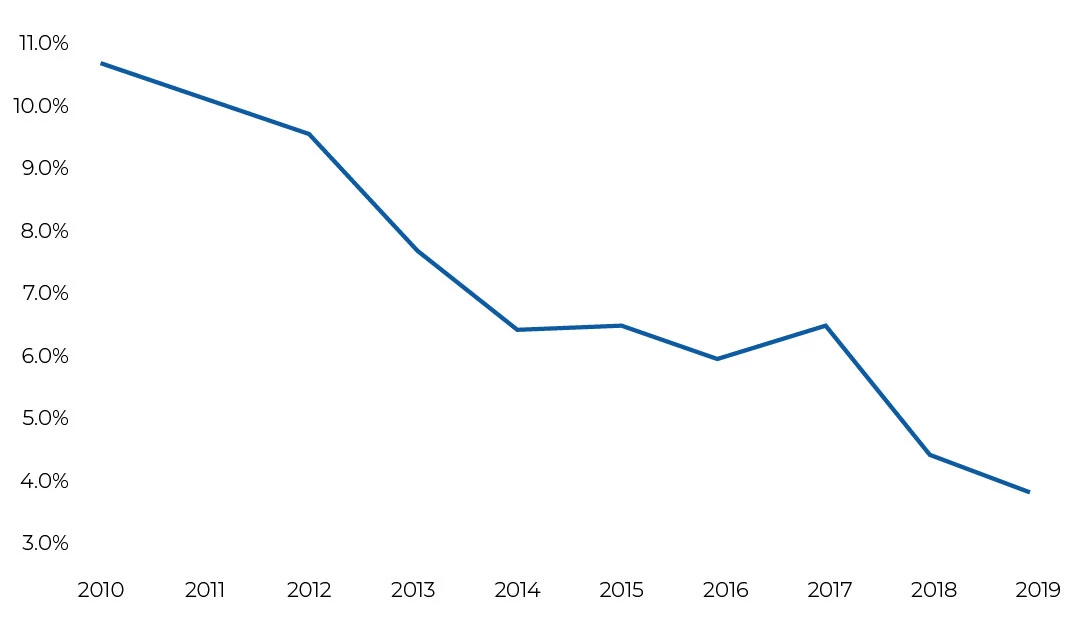
| Year | Executive Coach Unemployment Rate |
|---|---|
| 2010 | 10.64% |
| 2011 | 10.09% |
| 2012 | 9.54% |
| 2013 | 7.83% |
| 2014 | 6.50% |
| 2015 | 6.51% |
| 2016 | 6.01% |
| 2017 | 6.48% |
| 2018 | 4.49% |
| 2019 | 3.86% |
chapter 5:
Average Job Retention
Next, we have the statistics showing the average job retention per year to know more about the turnover rate and stable job retention capacity.

- By looking over 934 Executive Coaches resumes, we figured out that the average Executive Coach enjoys staying at their job for 11+ years for a percentage of 25%.(source)
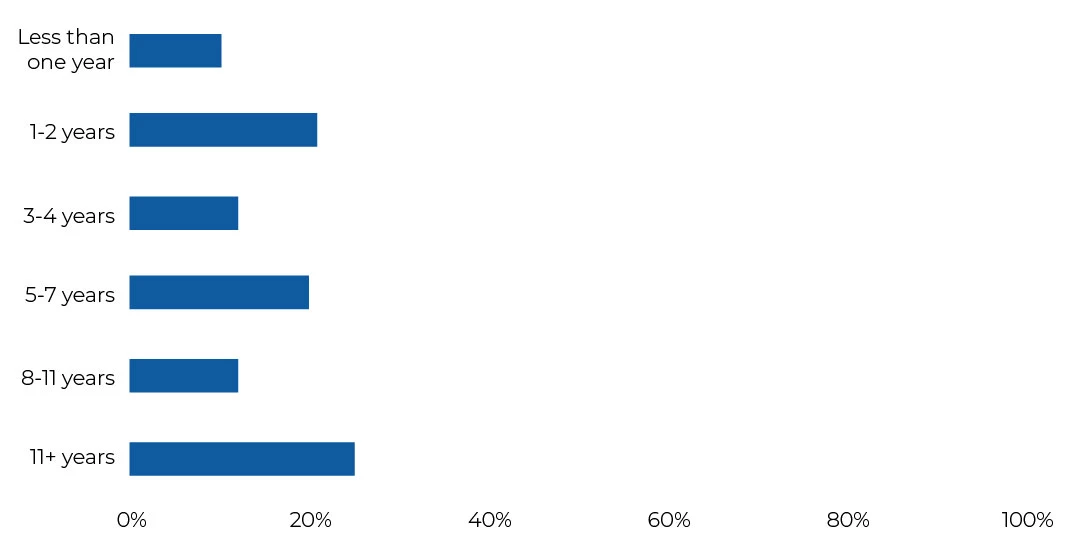
| Number or Years | Percentages |
|---|---|
| Less than 1 year | 10% |
| 1-2 years | 21% |
| 3-4 years | 12% |
| 5-7 years | 20% |
| 8-10 years | 12% |
| 11+ years | 25% |
chapter 6:
Executive Coach Employment Statistics
Digging into the crucial statistics of all in executive coaching that is the employment statistics to know more about career expansion, demands, and scope of opportunities.

- This section highlights the information we gathered about the types of businesses and industries that employ Executive Coaches. We found that the most common company type is Private. In addition, the industry that employs the most Executive Coaches is the Professional industry.
- We created this chart to show you the average size of companies that typically hire Executive Coaches.
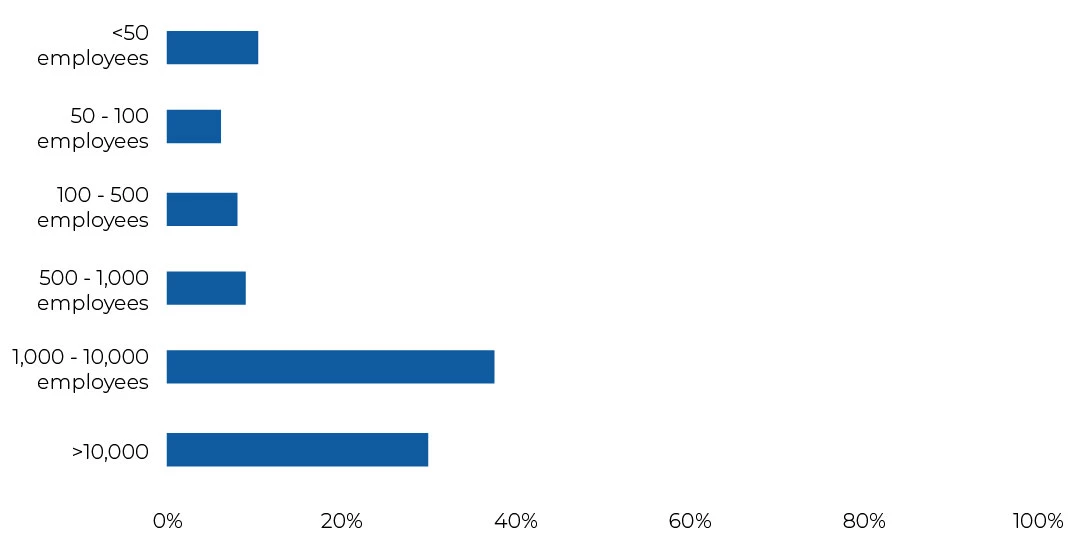
| Company Size | Percentages |
|---|---|
| < 50 employees | 10% |
| 50 - 100 employees | 6% |
| 100 - 500 employees | 8% |
| 500 - 1,000 employees | 9% |
| 1,000 - 10,000 employees | 38% |
| > 10,000 employees | 30% |
- Employees with the Executive Coach job title have their preferences when it comes to working for a company. For instance, most Executive Coaches prefer to work at Private companies over Public companies.
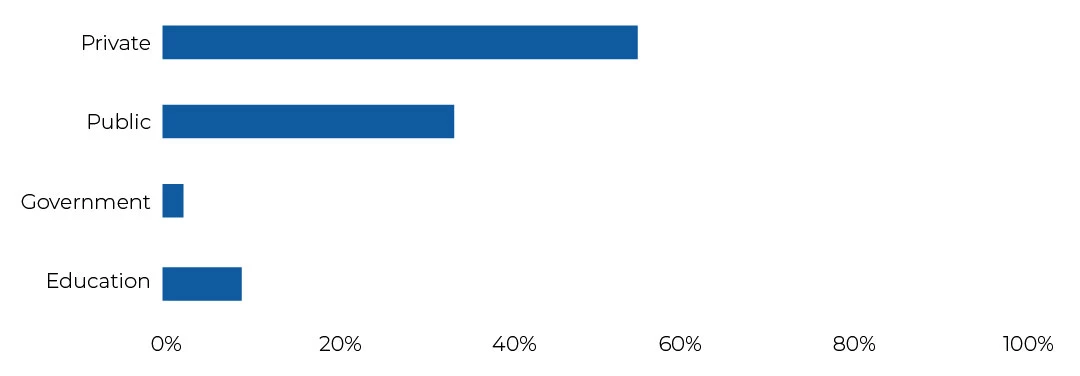
| Company Type | Percentages |
|---|---|
| Private | 55% |
| Public | 34% |
| Government | 2% |
| Education | 9% |
- The most common foreign language among Executive Coaches is Spanish at 50.0%. The second-most popular foreign language spoken is German at 7.1% and Portuguese is third-most popular at 4.8%. (source)
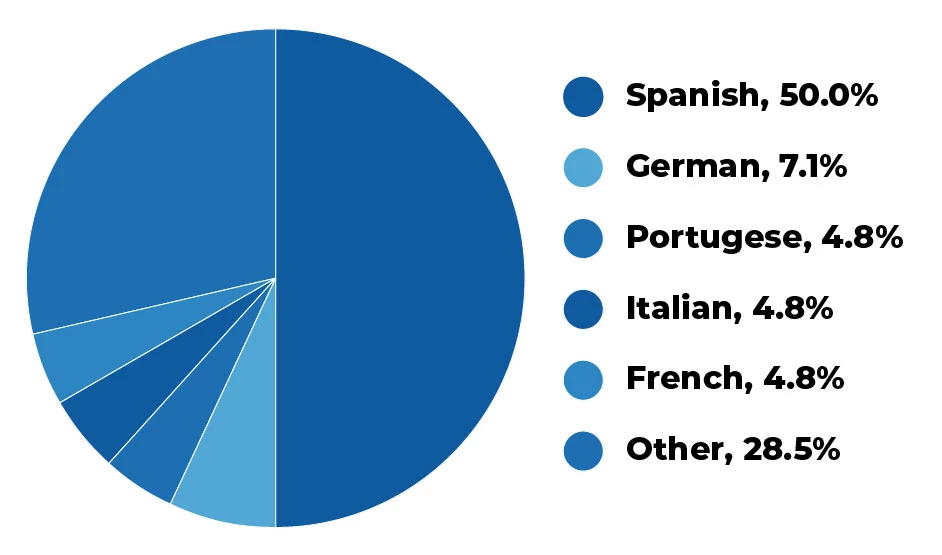
| Foreign Language | Percentages |
|---|---|
| Spanish | 50.0% |
| German | 7.1% |
| Portuguese | 4.8% |
| Italian | 4.8% |
| French | 4.8% |
| Other | 28.5% |
- After finding the gender ratio, we wondered if the percentages of LGBT persons were different as well. Using the data below, you can see how other job titles compare to Executive Coaches. (source)
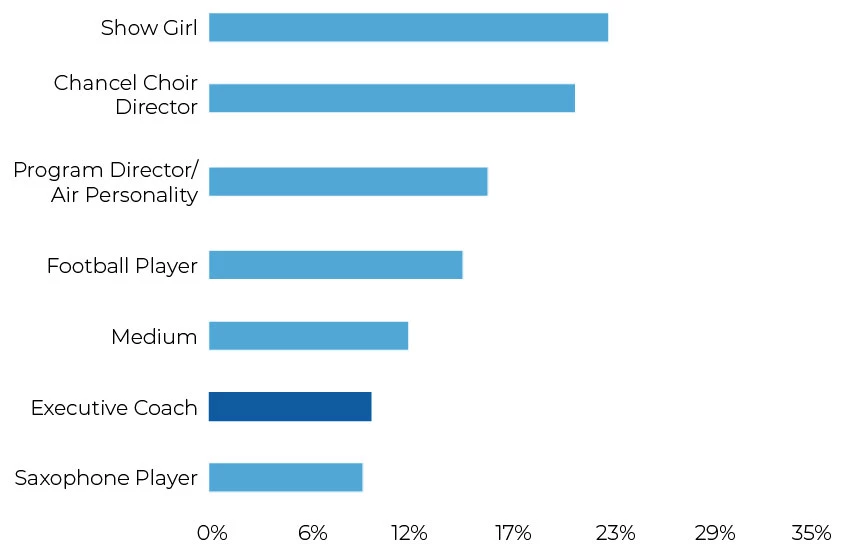
| Profession | Percentages of LGBT | Job Openings |
|---|---|---|
| Saxophone Player | 8.82% | 124 |
| Medium | 11.39% | 6,420 |
| Football Player | 14.59% | 326 |
| Program Director/Air Personality | 16.02% | 64,131 |
| Chancel Choir Director | 21.16% | 1,014 |
| Show Girl | 23.07% | 490 |
chapter 7:
Income
Moving to the stats regarding income earned by life coaching professionals and the revenue generated from the life coaching industry.

- In 2019, our average executive base salary averaged $179,963, and client compensation packages ranged from $85,000 – $650,000. In 2020, the base salary for our newly placed clients was $206,173.81 and packages ranged from $95,000 to $1M+. This dramatic increase seems to have three primary contributing factors. (source)
- The median annual wage for chief executives was $181,210 in May 2016. The median wage is the wage at which half the workers in an occupation earned more than that amount and half earned less. The lowest 10 percent earned less than $69,780, and the highest 10 percent earned more than $208,000.(source)
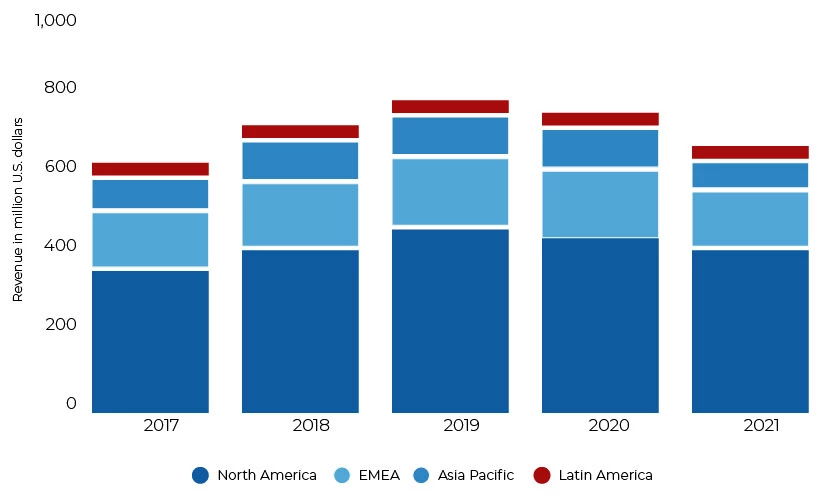
- In 2021, the majority of fee revenue generated by Korn Ferry's executive search segment was from North America, totaling just under 400 million U.S. dollars. (source)
- The market size of the executive search industry increased considerably between 2012 and 2020. In 2020, the global executive search industry was estimated to be worth 18 billion euros, eight billion euros more than in 2012. In 2019, the world’s leading executive search firm in terms of revenue was Korn Ferry, with nearly two billion U.S. dollars in revenue. (source)
- In 2019, the largest executive recruitment and leadership consulting firm operating in the U.S. market was Korn Ferry, which generated just over one billion U.S. dollars in revenue in that year. This was significantly higher than the next largest firm, Spencer Stuart, who generated only 554.5 million U.S. dollars in revenue in the U.S.(source)
Conclusion
I hope you found this mega list of executive coaching statistics interesting and insightful.
Now I’d like to hear your thoughts:
Which coaching stat from this list surprised you the most?
Or maybe there’s a stat out there that I overlooked (it happens 🙂).
Let me know by leaving a quick comment below.
